Alex 👾 does 🏗️ Data 🎛️

- Data Viz 13
- Tableau 8
- ETL 4
- Python 4
- Illustrator 3
- GIS 2
- Graphic Design 2
- Mapping 2
- SQL 2
- D3.js 1
- Machine Learning 1
- NLP 1
- Power BI 1
©2025 Alexander Reese
Monthly Client Churn in Power BI
Built Power BI dashboards from scratch to establish the first-ever client churn analysis system for a healthcare non-profit, revealing seasonal patterns and program impact insights that enabled data-driven service optimization.
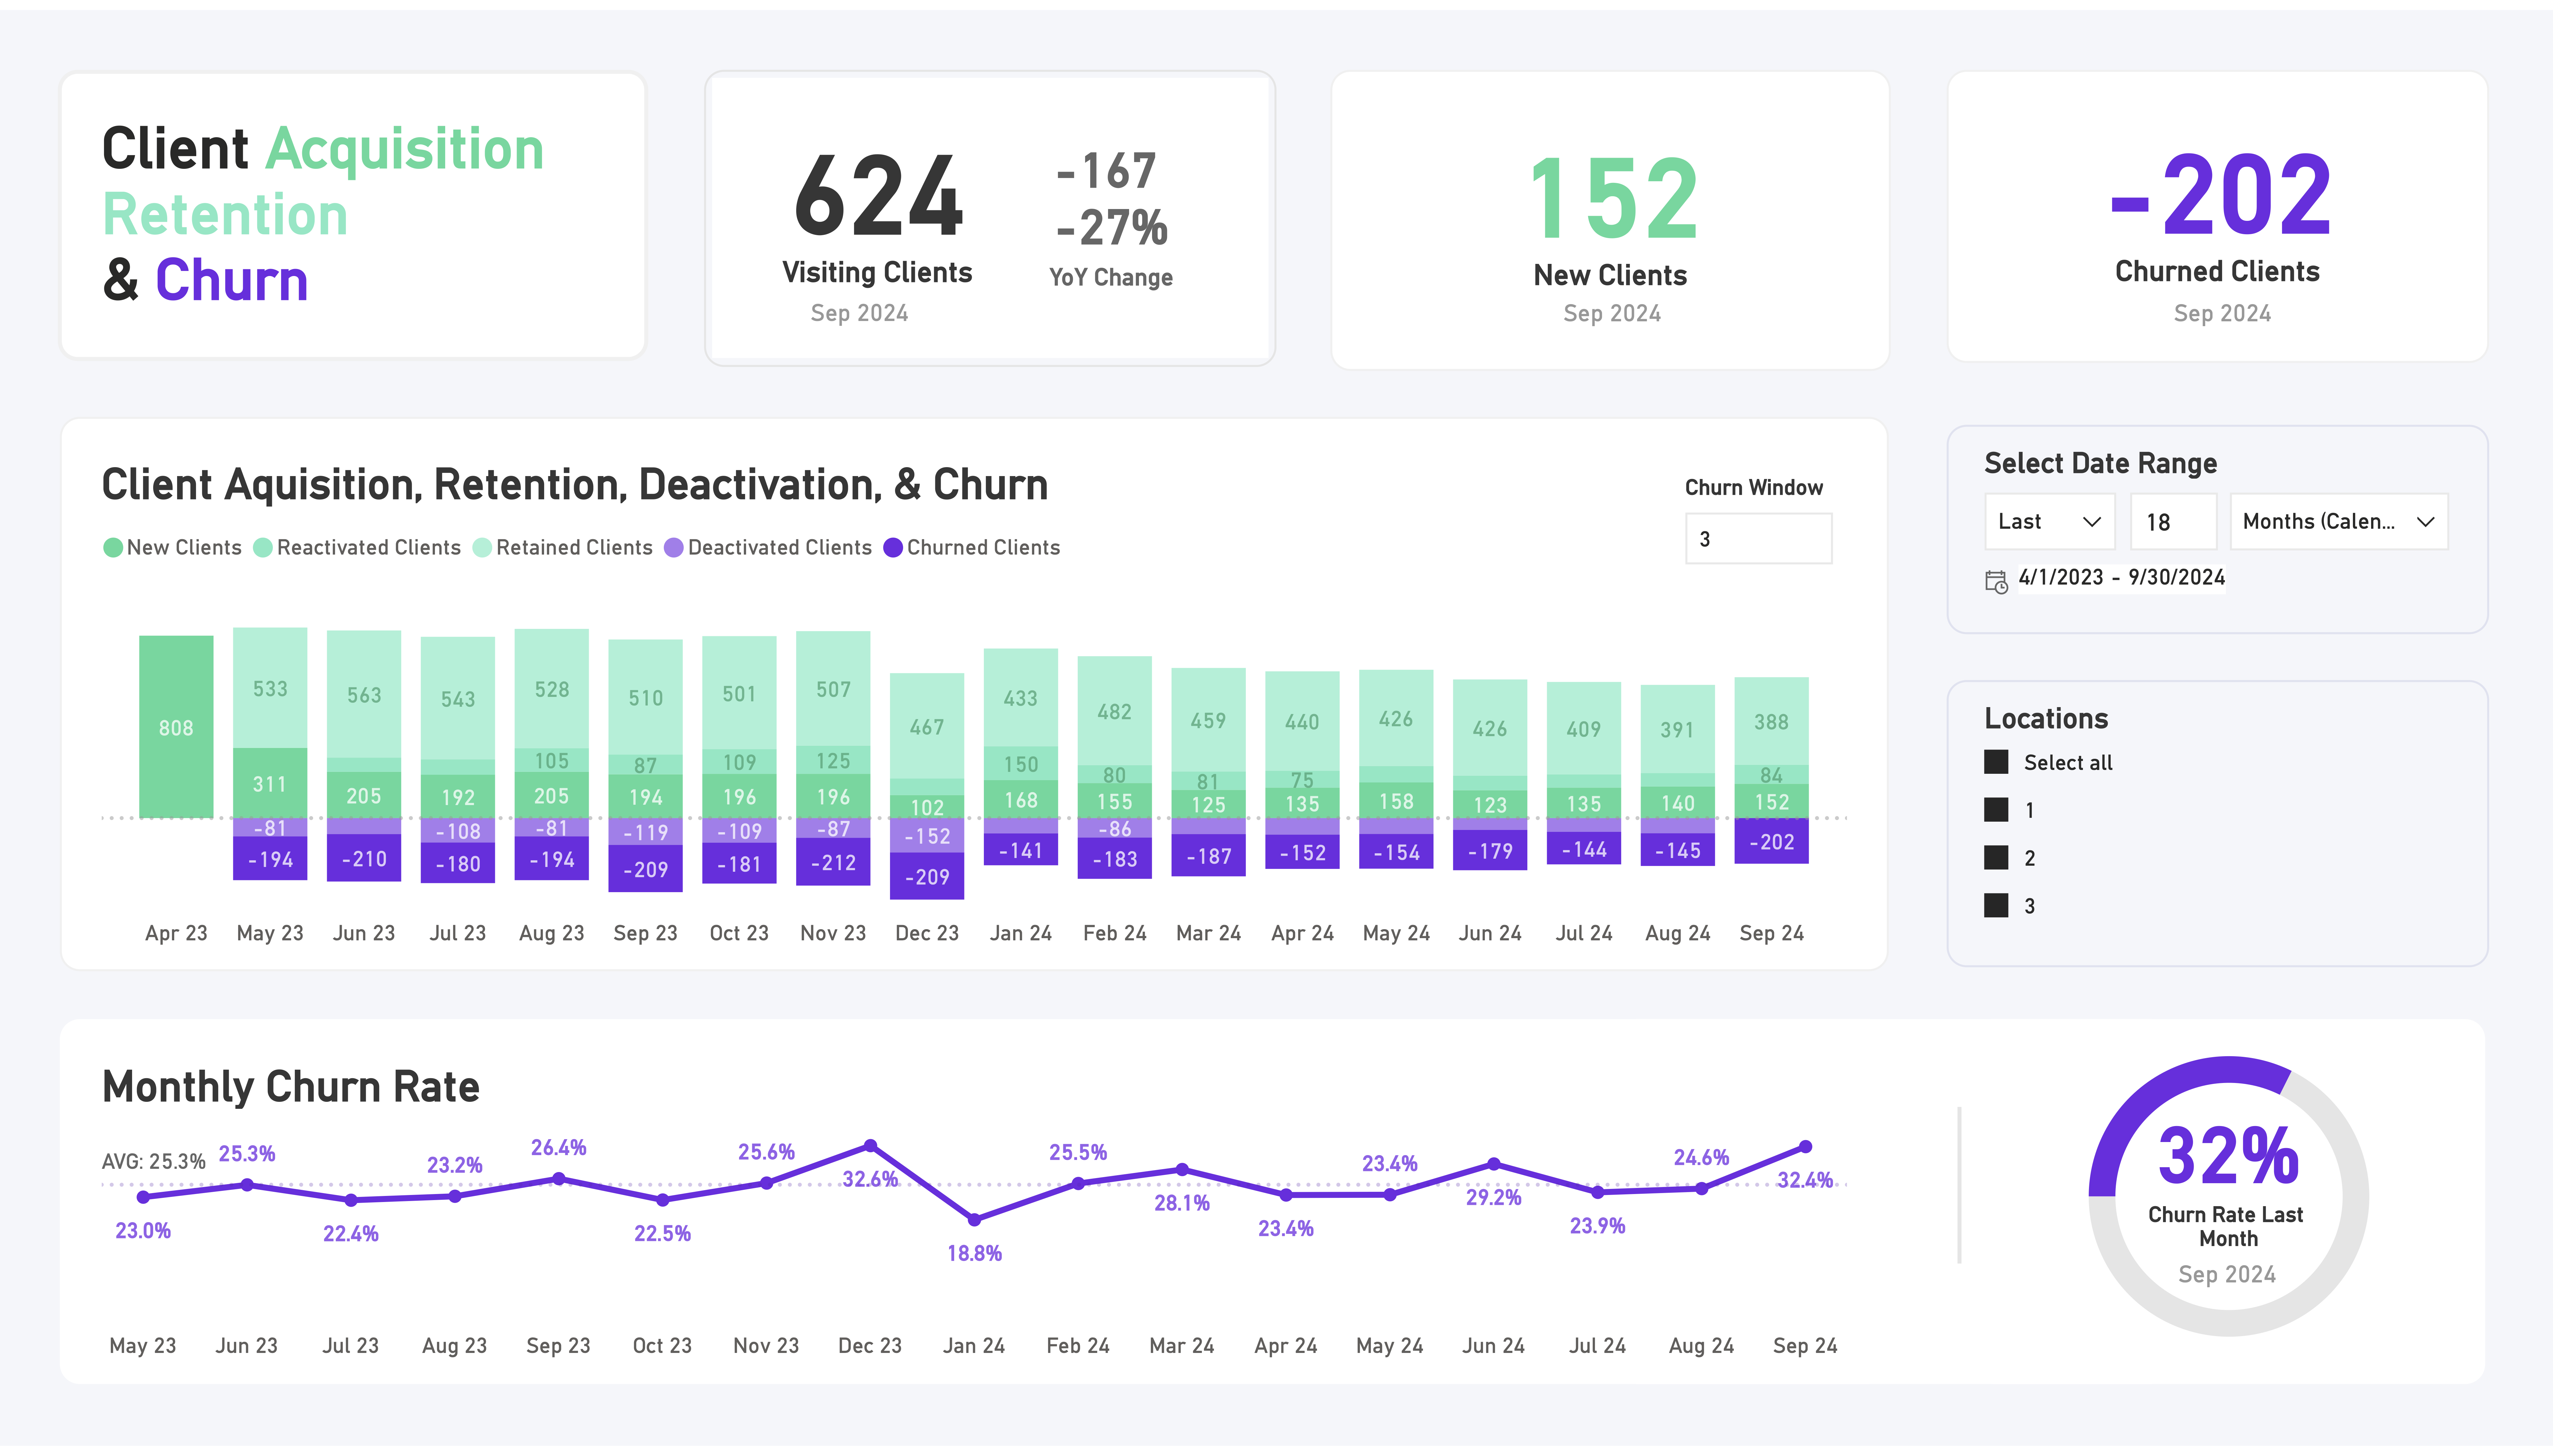
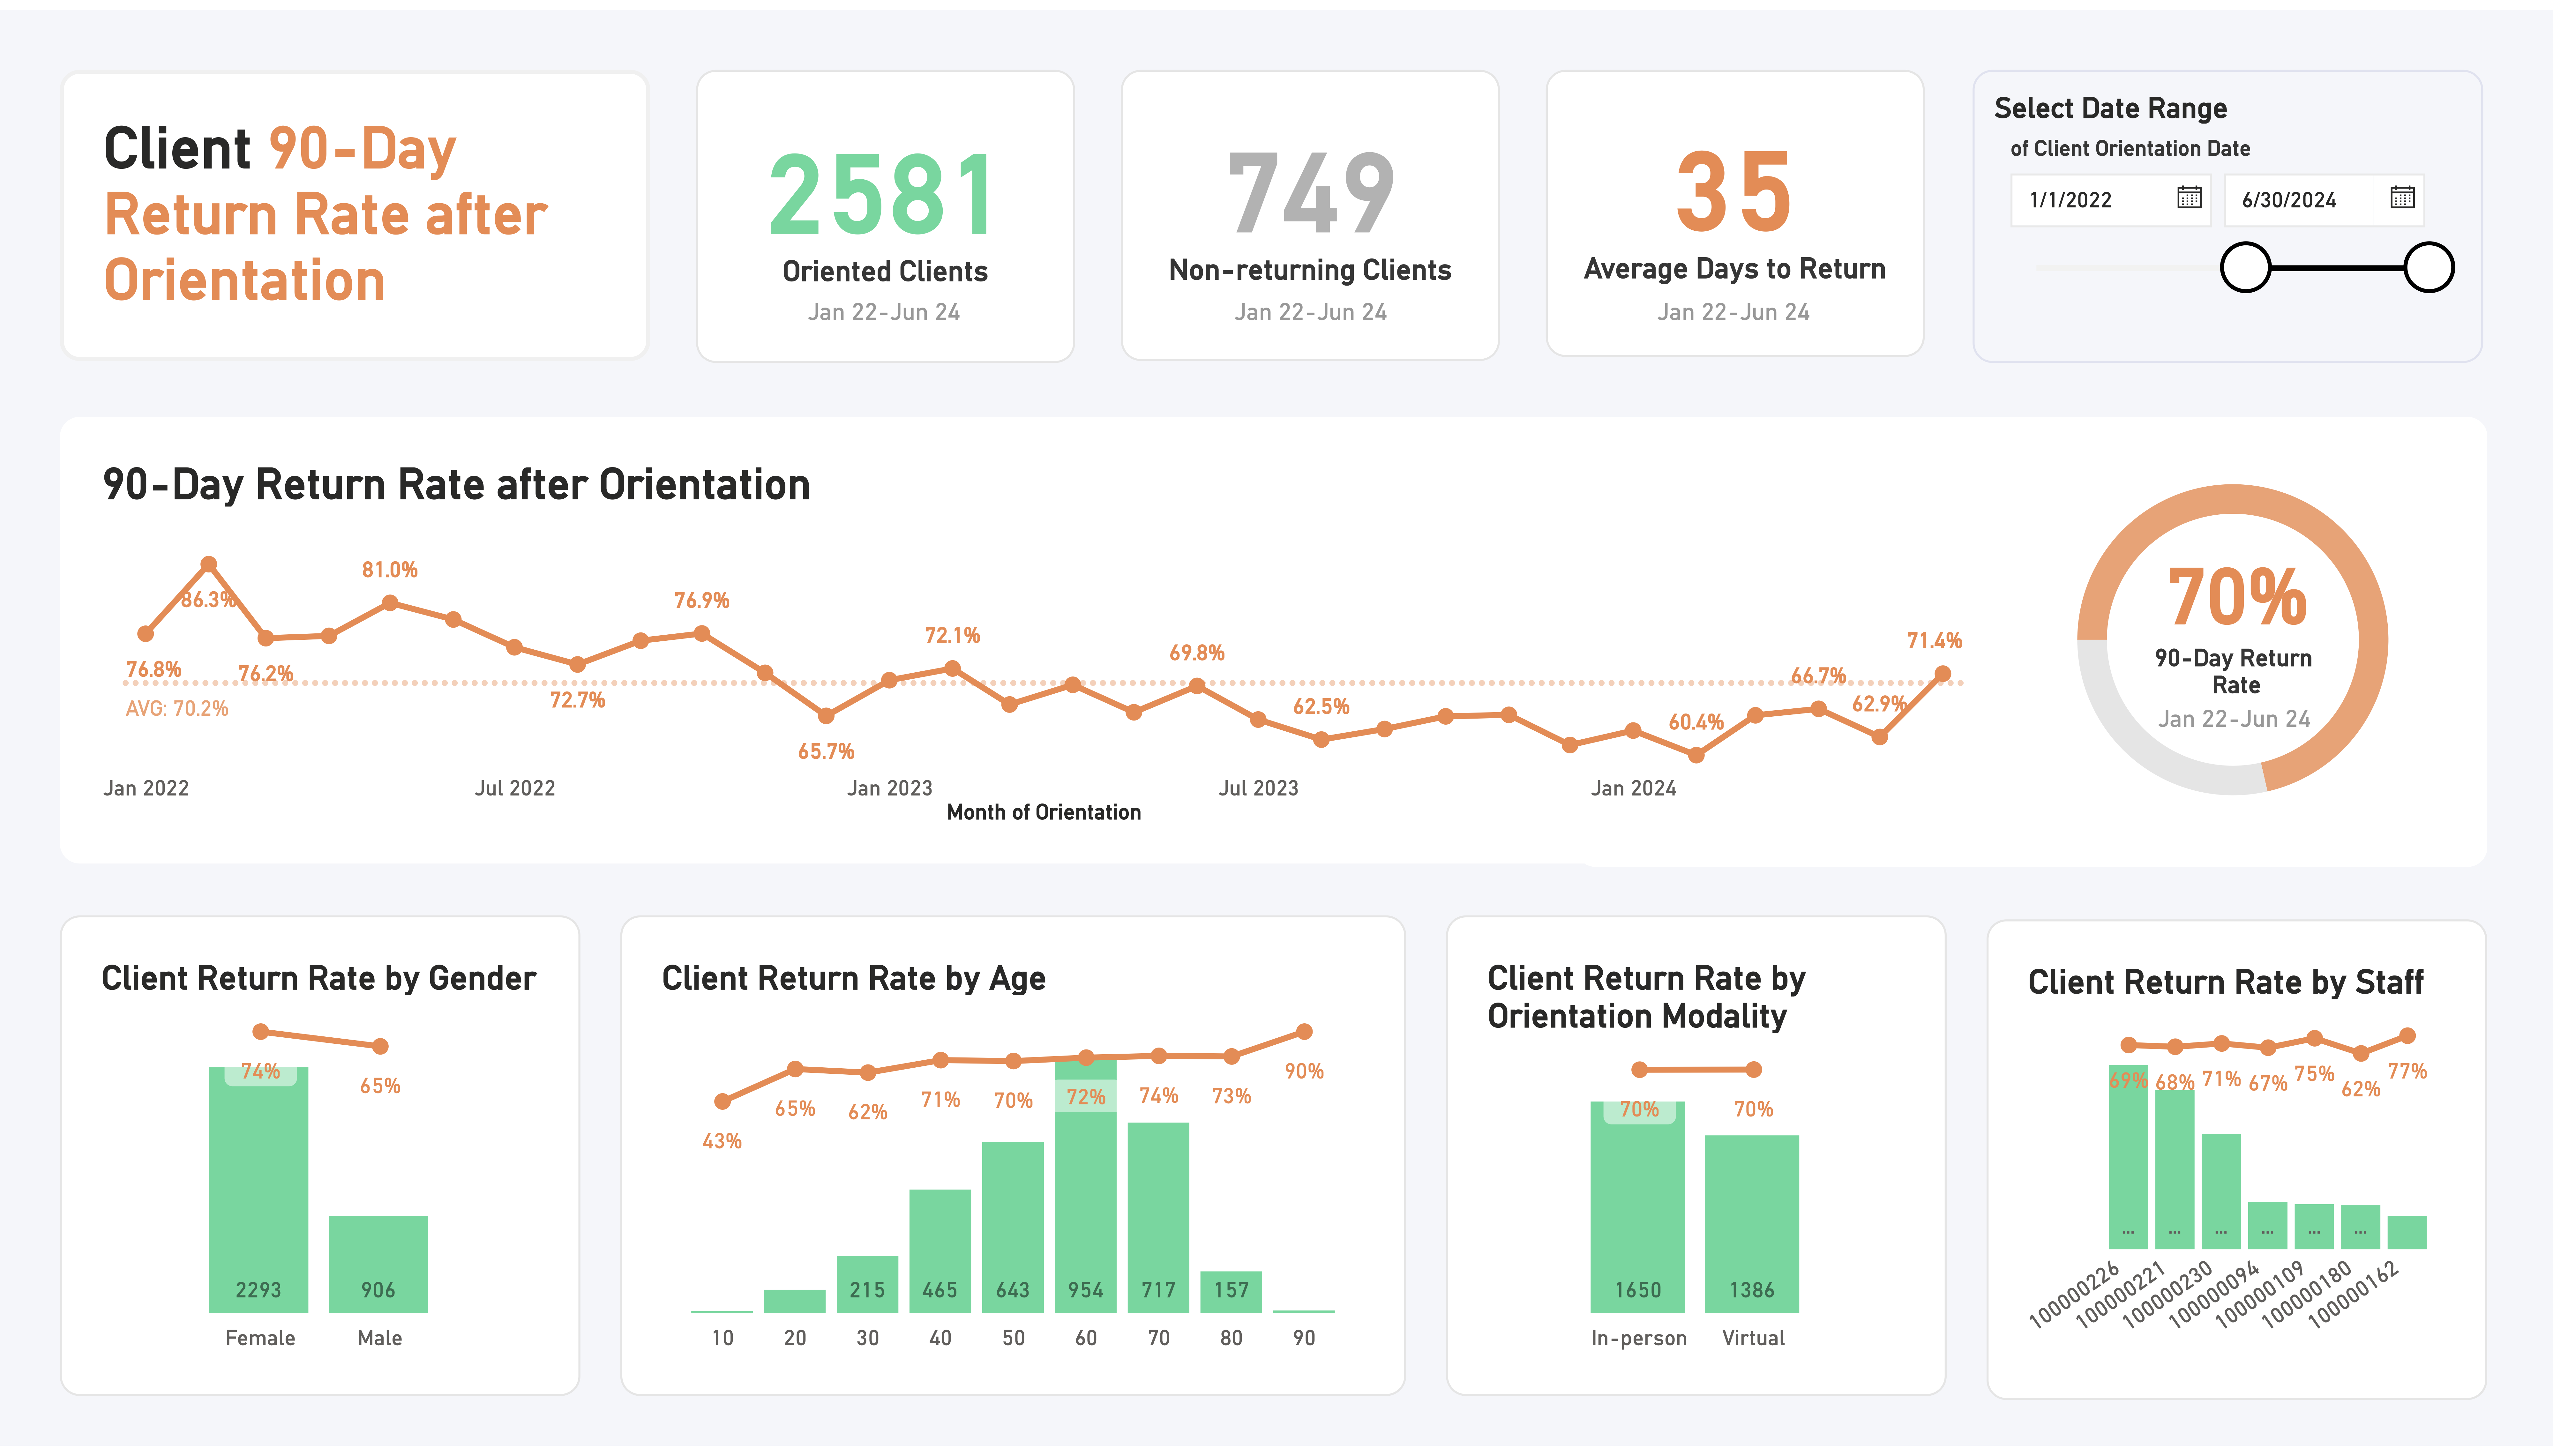
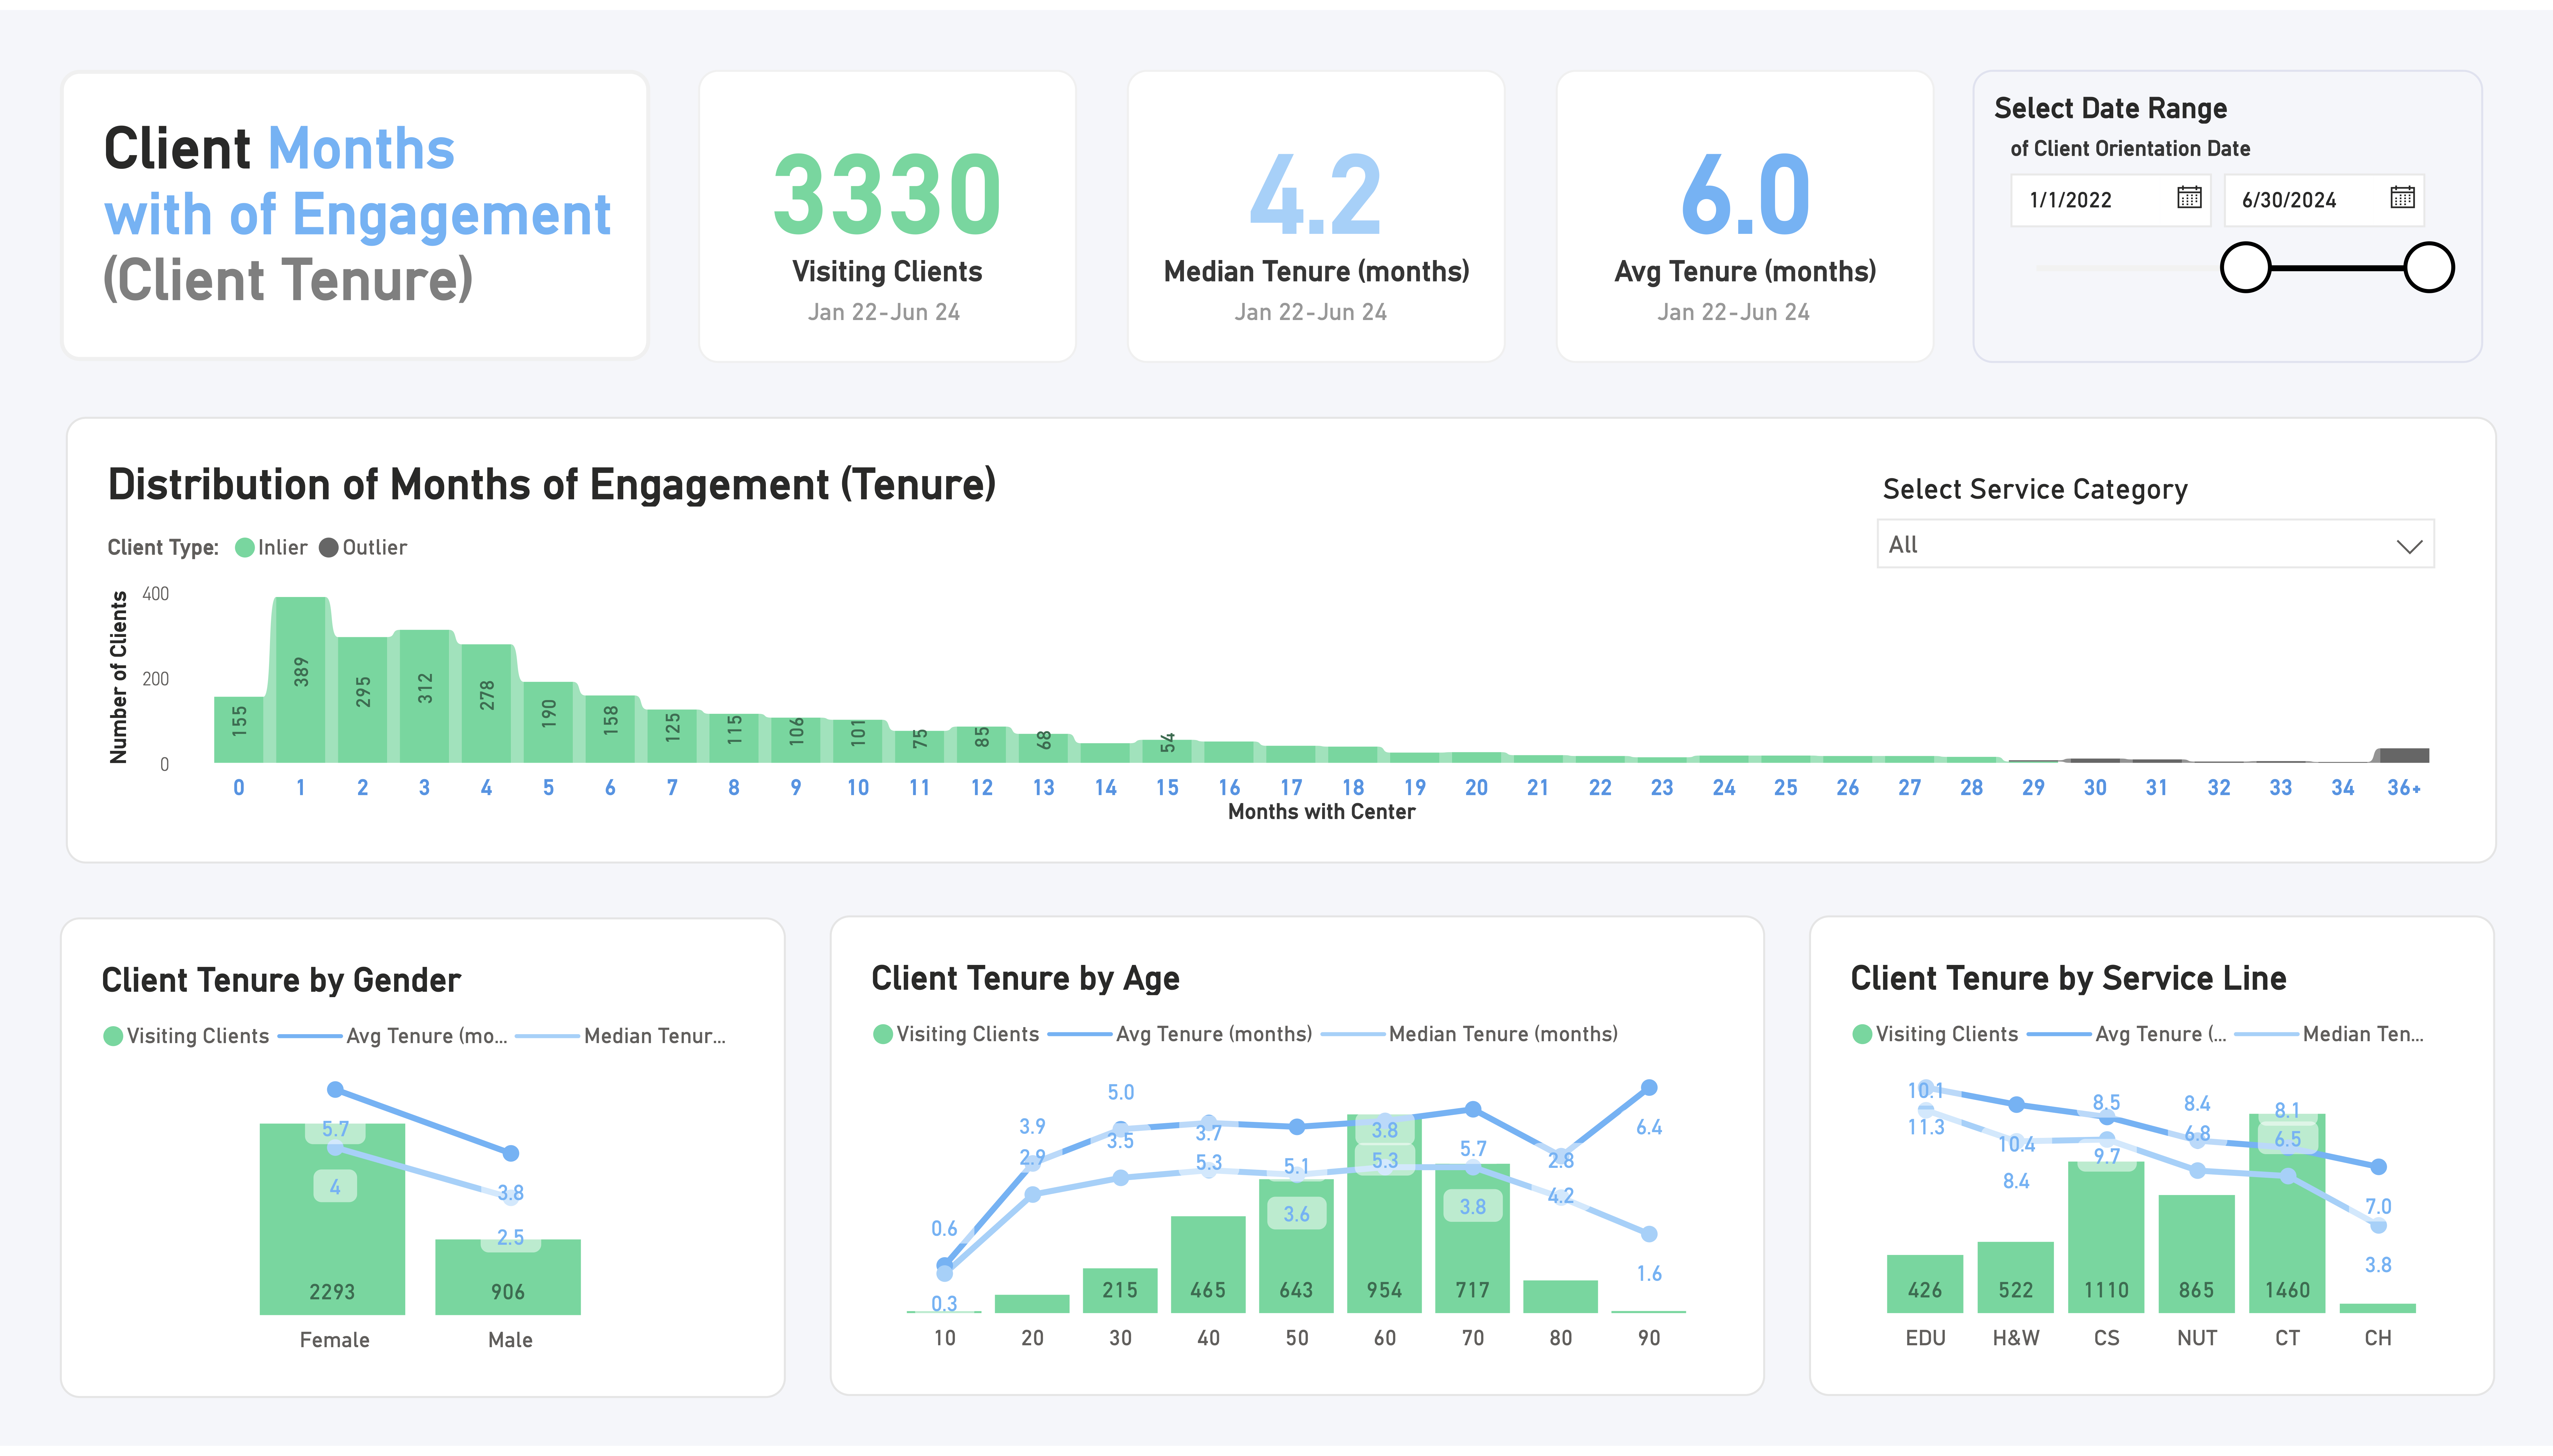
Client Churn, Retention, and Tenure Dashboard Series
Project Impact: This healthcare non-profit had no existing framework for analyzing client churn or retention patterns. I designed and built a three-dashboard Power BI solution that became their primary tool for understanding client engagement and informing program decisions. The analysis revealed important seasonal patterns in client participation and suggested that recent changes to program offerings may have influenced retention rates, enabling leadership to make evidence-based adjustments to service delivery.
Technical Implementation:
- Data Modeling: Built comprehensive data model integrating client demographics, service usage, and attendance data
- Power Query Transformations: Created custom ETL processes to clean and structure client activity data
- DAX Calculations: Developed complex measures for churn rates, cohort analysis, and retention metrics
- Dashboard Design: Designed three interconnected dashboards using custom visualizations including donut charts as KPI gauges
Three-Dashboard System:
- Churn Analysis: Monthly and quarterly churn rates by location, service type, and client demographics
- Post-Orientation Retention: Return rates tracking client engagement following initial orientation sessions
- Client Tenure: Analysis of client longevity patterns and factors influencing long-term engagement
The dashboards enabled leadership to identify at-risk client segments, optimize resource allocation across locations, and evaluate the impact of program changes on client retention.