Alex 👾 does 🏗️ Data 🎛️

- Data Viz 13
- Tableau 8
- ETL 4
- Python 4
- Illustrator 3
- GIS 2
- Graphic Design 2
- Mapping 2
- SQL 2
- D3.js 1
- Machine Learning 1
- NLP 1
- Power BI 1
©2025 Alexander Reese
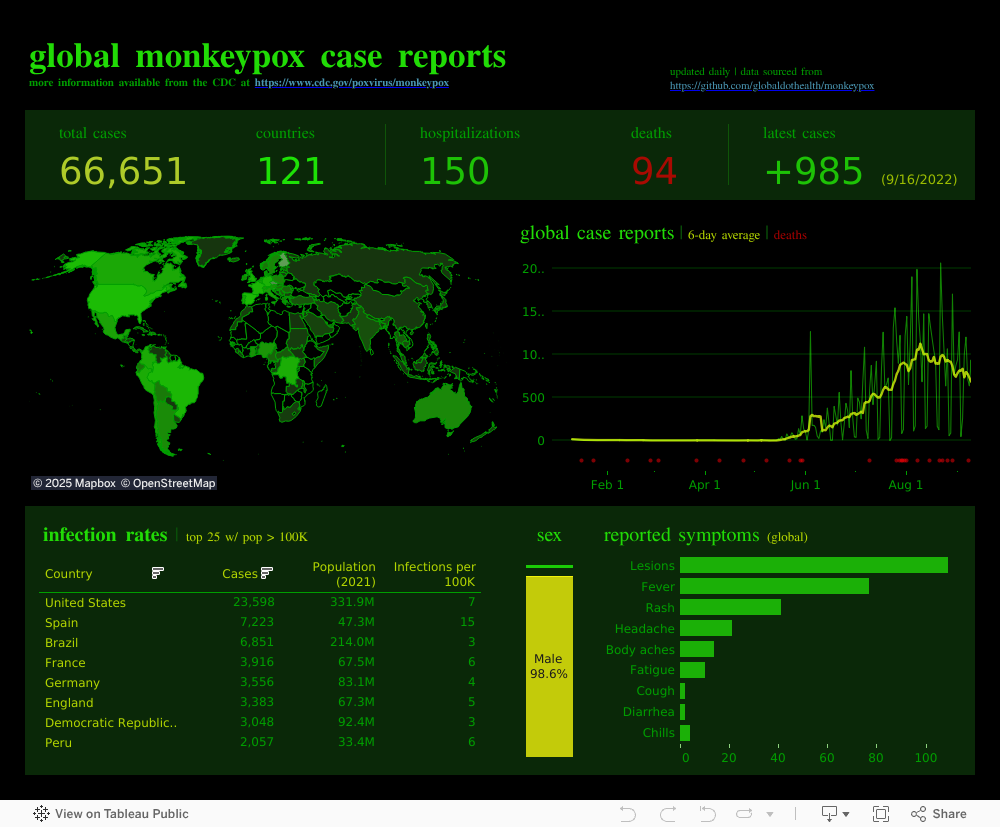
Automated Monkeypox Case Dashboard
Built a daily-updating public health dashboard during the 2022 monkeypox emergency to keep case counts fresh without manual effort. The pipeline ingests public health data, validates it, and pushes it straight to a Tableau-ready database so outbreaks can be monitored in near real time.
What I built
- Automated ETL that pulls daily case data, standardizes geography/demographics, and runs light validation checks before loading into Amazon RDS PostgreSQL.
- Tableau dashboard with filters for region, date, and case characteristics plus time-series views for outbreak progression.
Impact
- Replaced manual spreadsheet updates with a timed Lambda workflow; data stayed current for briefings without human babysitting.
- Reduced refresh time to minutes and enabled stakeholders to self-serve trends by geography and demographic slices.
How it works
- AWS Lambda triggers Python ETL to extract public health APIs, transform, and validate records.
- Amazon RDS PostgreSQL hosts the cleaned dataset for visualization and ad hoc queries.
- Tableau connects to the database (production) with a manual publish fallback for Tableau Public.
Production note
Tableau Public can’t keep a live connection, so the public embed is republished manually. A Tableau Server/Power BI deployment keeps the production version on a live database connection with the same visuals and alerts for late data.