Alex 👾 does 🏗️ Data 🎛️

- Data Viz 13
- Tableau 8
- ETL 4
- Python 4
- Illustrator 3
- GIS 2
- Graphic Design 2
- Mapping 2
- SQL 2
- D3.js 1
- Machine Learning 1
- NLP 1
- Power BI 1
©2025 Alexander Reese
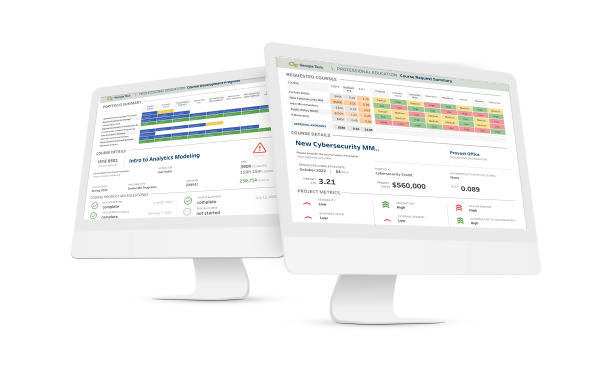
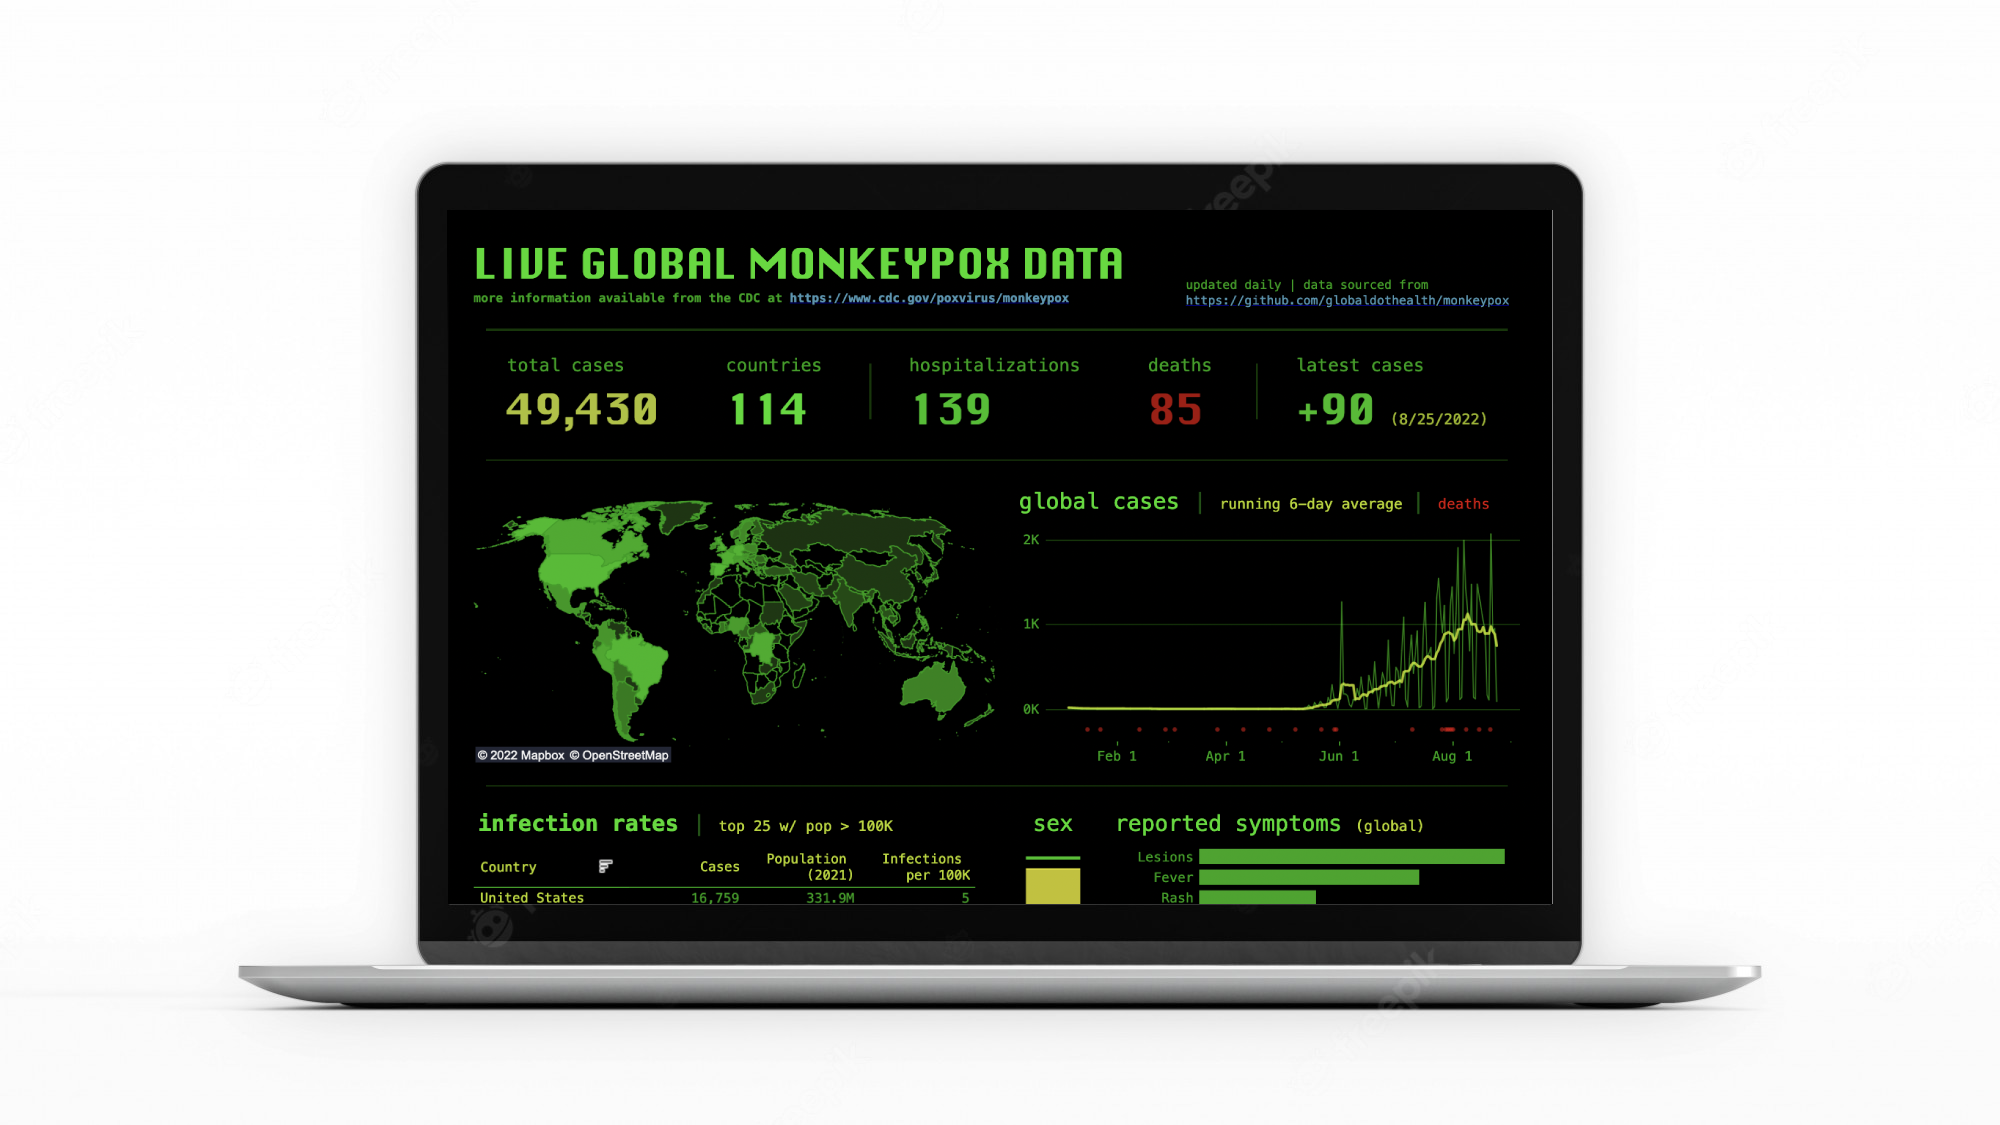
Automated Monkeypox Case Dashboard
Built a daily-updating public health dashboard during the 2022 monkeypox emergency to keep case counts fresh without manual effort. The pipeline ingests public health data, validates it, and pushes it straight to a Tableau-ready database so outbreaks can be monitored in near real time.
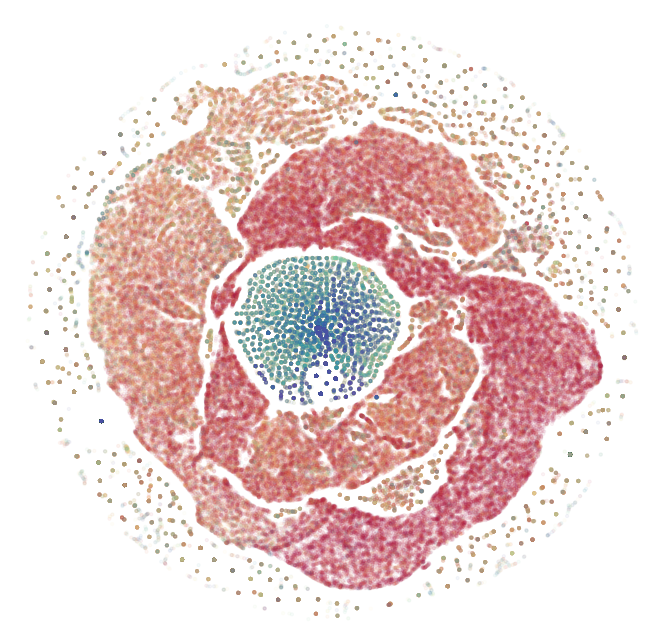
COVID Authorship Community Detection with Machine Learning
Early grad-school experiment: mapped COVID-19 co-authorship to see how different clustering methods reveal the research network. Built a large collaboration graph, compared Infomap clusters to GraphSAGE embeddings, and visualized the differences.
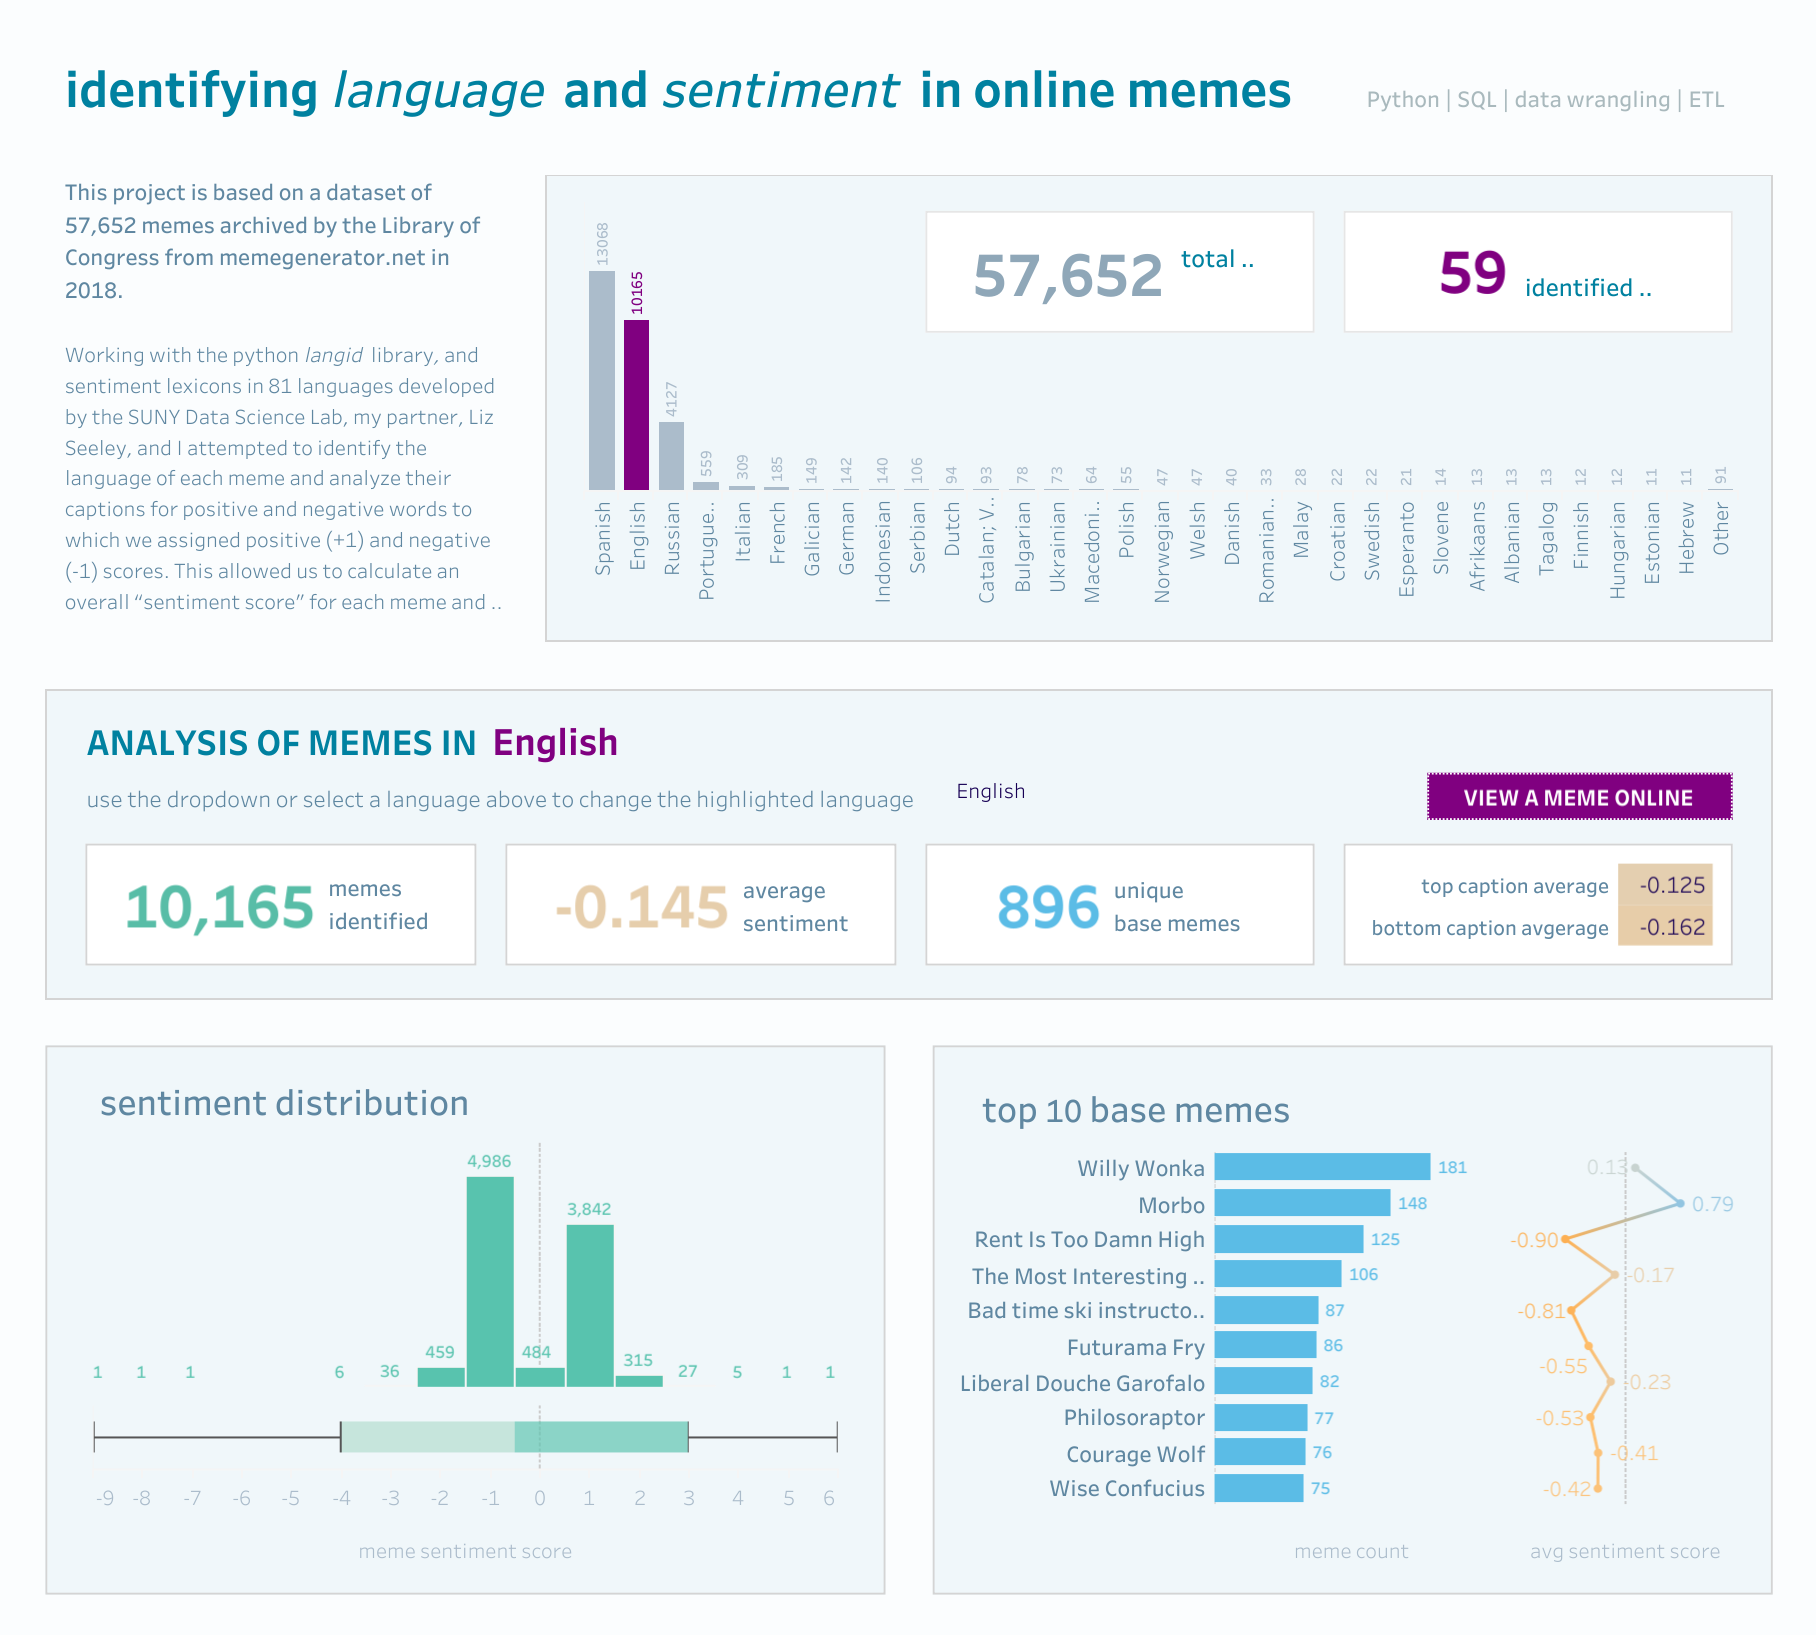
Meme Generator Natural Language Processing and Sentiment Analysis
Built a lightweight meme sentiment explorer with collaborator Liz Seeley to practice multilingual NLP and dashboarding. The project ingests 57,000+ meme instances across 82 languages, scores sentiment with lexicons, and lets you slice the results in Tableau without taking itself too seriously.